Cost Comparison
Feature Detail
Description
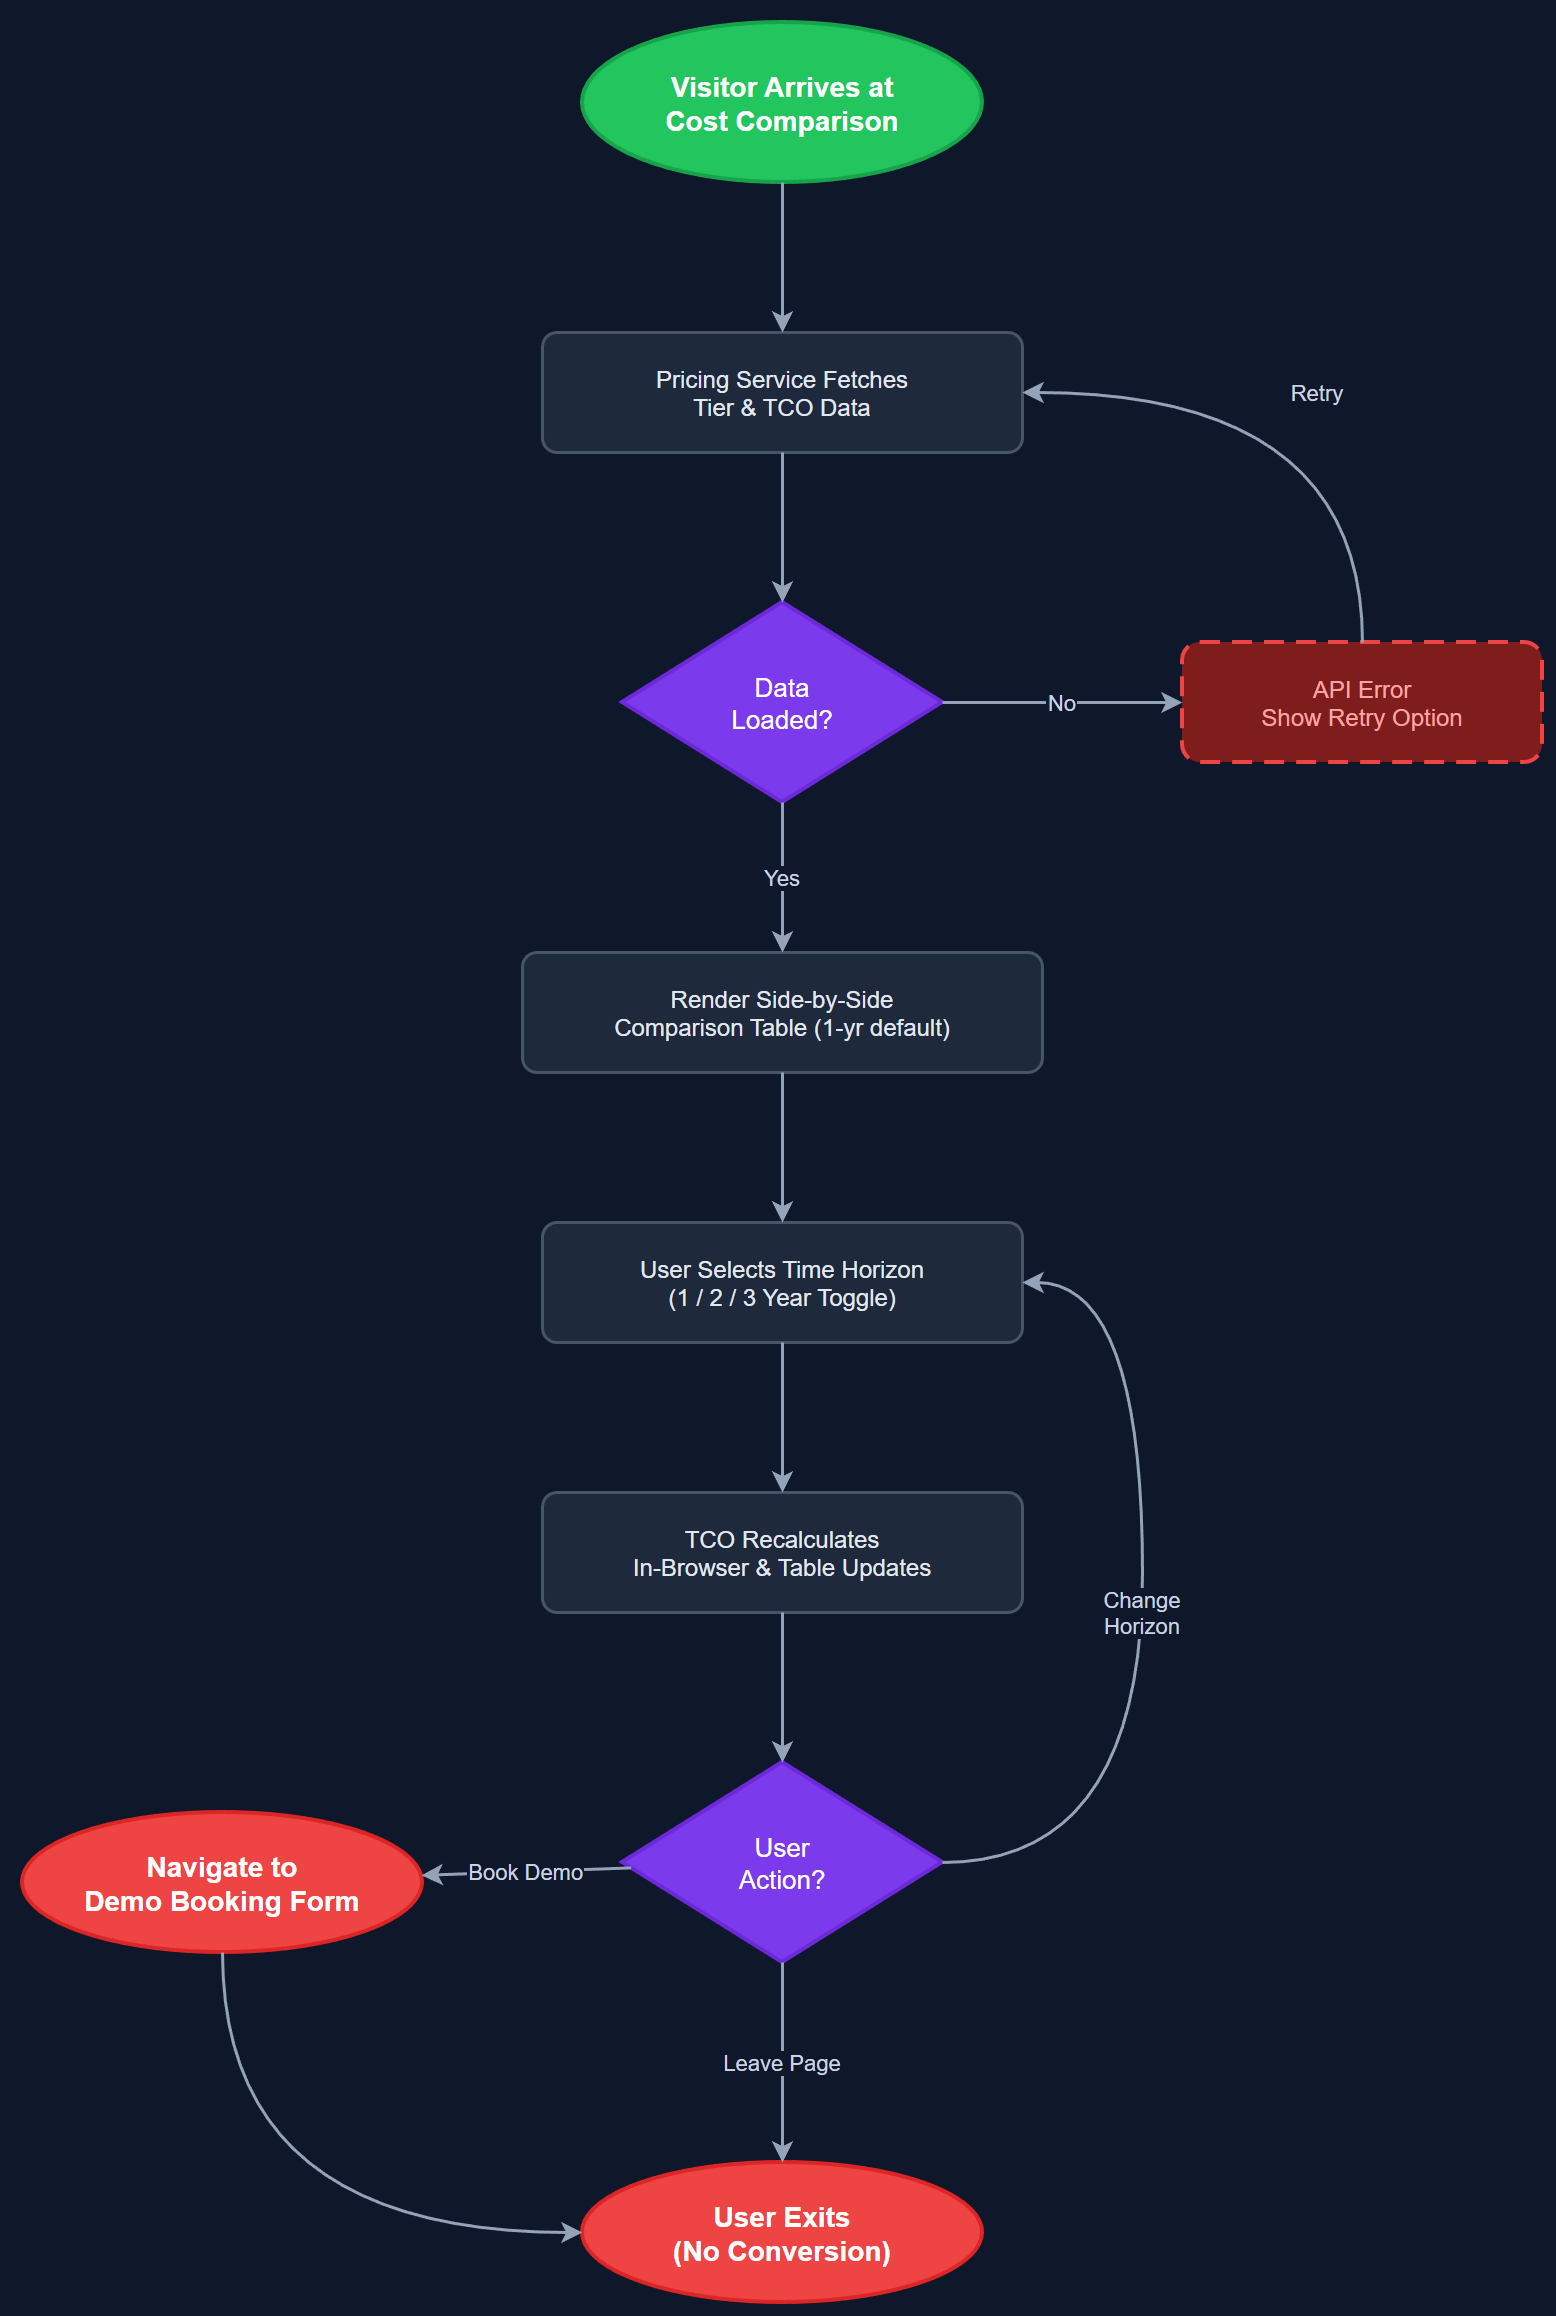
The Cost Comparison feature presents a structured side-by-side comparison of the costs and operational overhead of existing solutions (manual Excel/Word workflows, generic tools) versus the Meander platform. It displays pricing tiers, included features, and estimated total cost of ownership across a one- to three-year horizon, helping decision-makers understand what they are replacing and at what cost delta. The comparison is presented as an interactive or static table component on the sales website, positioned as a trust-building element late in the buyer journey.
User Flow
Analysis
Procurement decisions in Norwegian non-profit organizations typically involve multiple stakeholders including finance leads and board members who require clear cost justification before approving new software spend. The Cost Comparison page addresses this directly by framing Meander's pricing against the hidden costs of current workflows: coordinator hours, manual aggregation, error correction, and Bufdir reporting overhead. By making this calculation visible and credible, Norse Digital Products reduces friction in the final stages of the sales funnel and pre-empts the most common objection — that the platform is an added cost rather than a cost replacement. The feature also supports upsell discussions during demo calls by providing a shared reference point.
This feature can be implemented as a static or lightly dynamic Next.js page component. The comparison table should cover at minimum three columns: current state (manual), Meander Starter, and Meander Full. Rows should include setup effort, monthly cost per mentor, reporting hours per month, Bufdir compliance, support model, and integration capabilities. Pricing data is hardcoded or sourced from a simple CMS or environment-configured JSON file — no dynamic pricing API is needed at this stage. The table must be fully accessible: use semantic HTML table elements with proper thead/tbody/th scope attributes for screen reader compatibility. A sticky header or highlighted column for the recommended tier improves visual hierarchy. The page should link to the demo booking form and optionally embed the impact calculator output as a personalized cost delta.
Components (111)
Shared Components
These components are reused across multiple features
User Interface (12)
Service Layer (34)
Data Layer (22)
Infrastructure (38)
User Stories
No user stories have been generated for this feature yet.