Dashboard KPIs
Feature Detail
Description
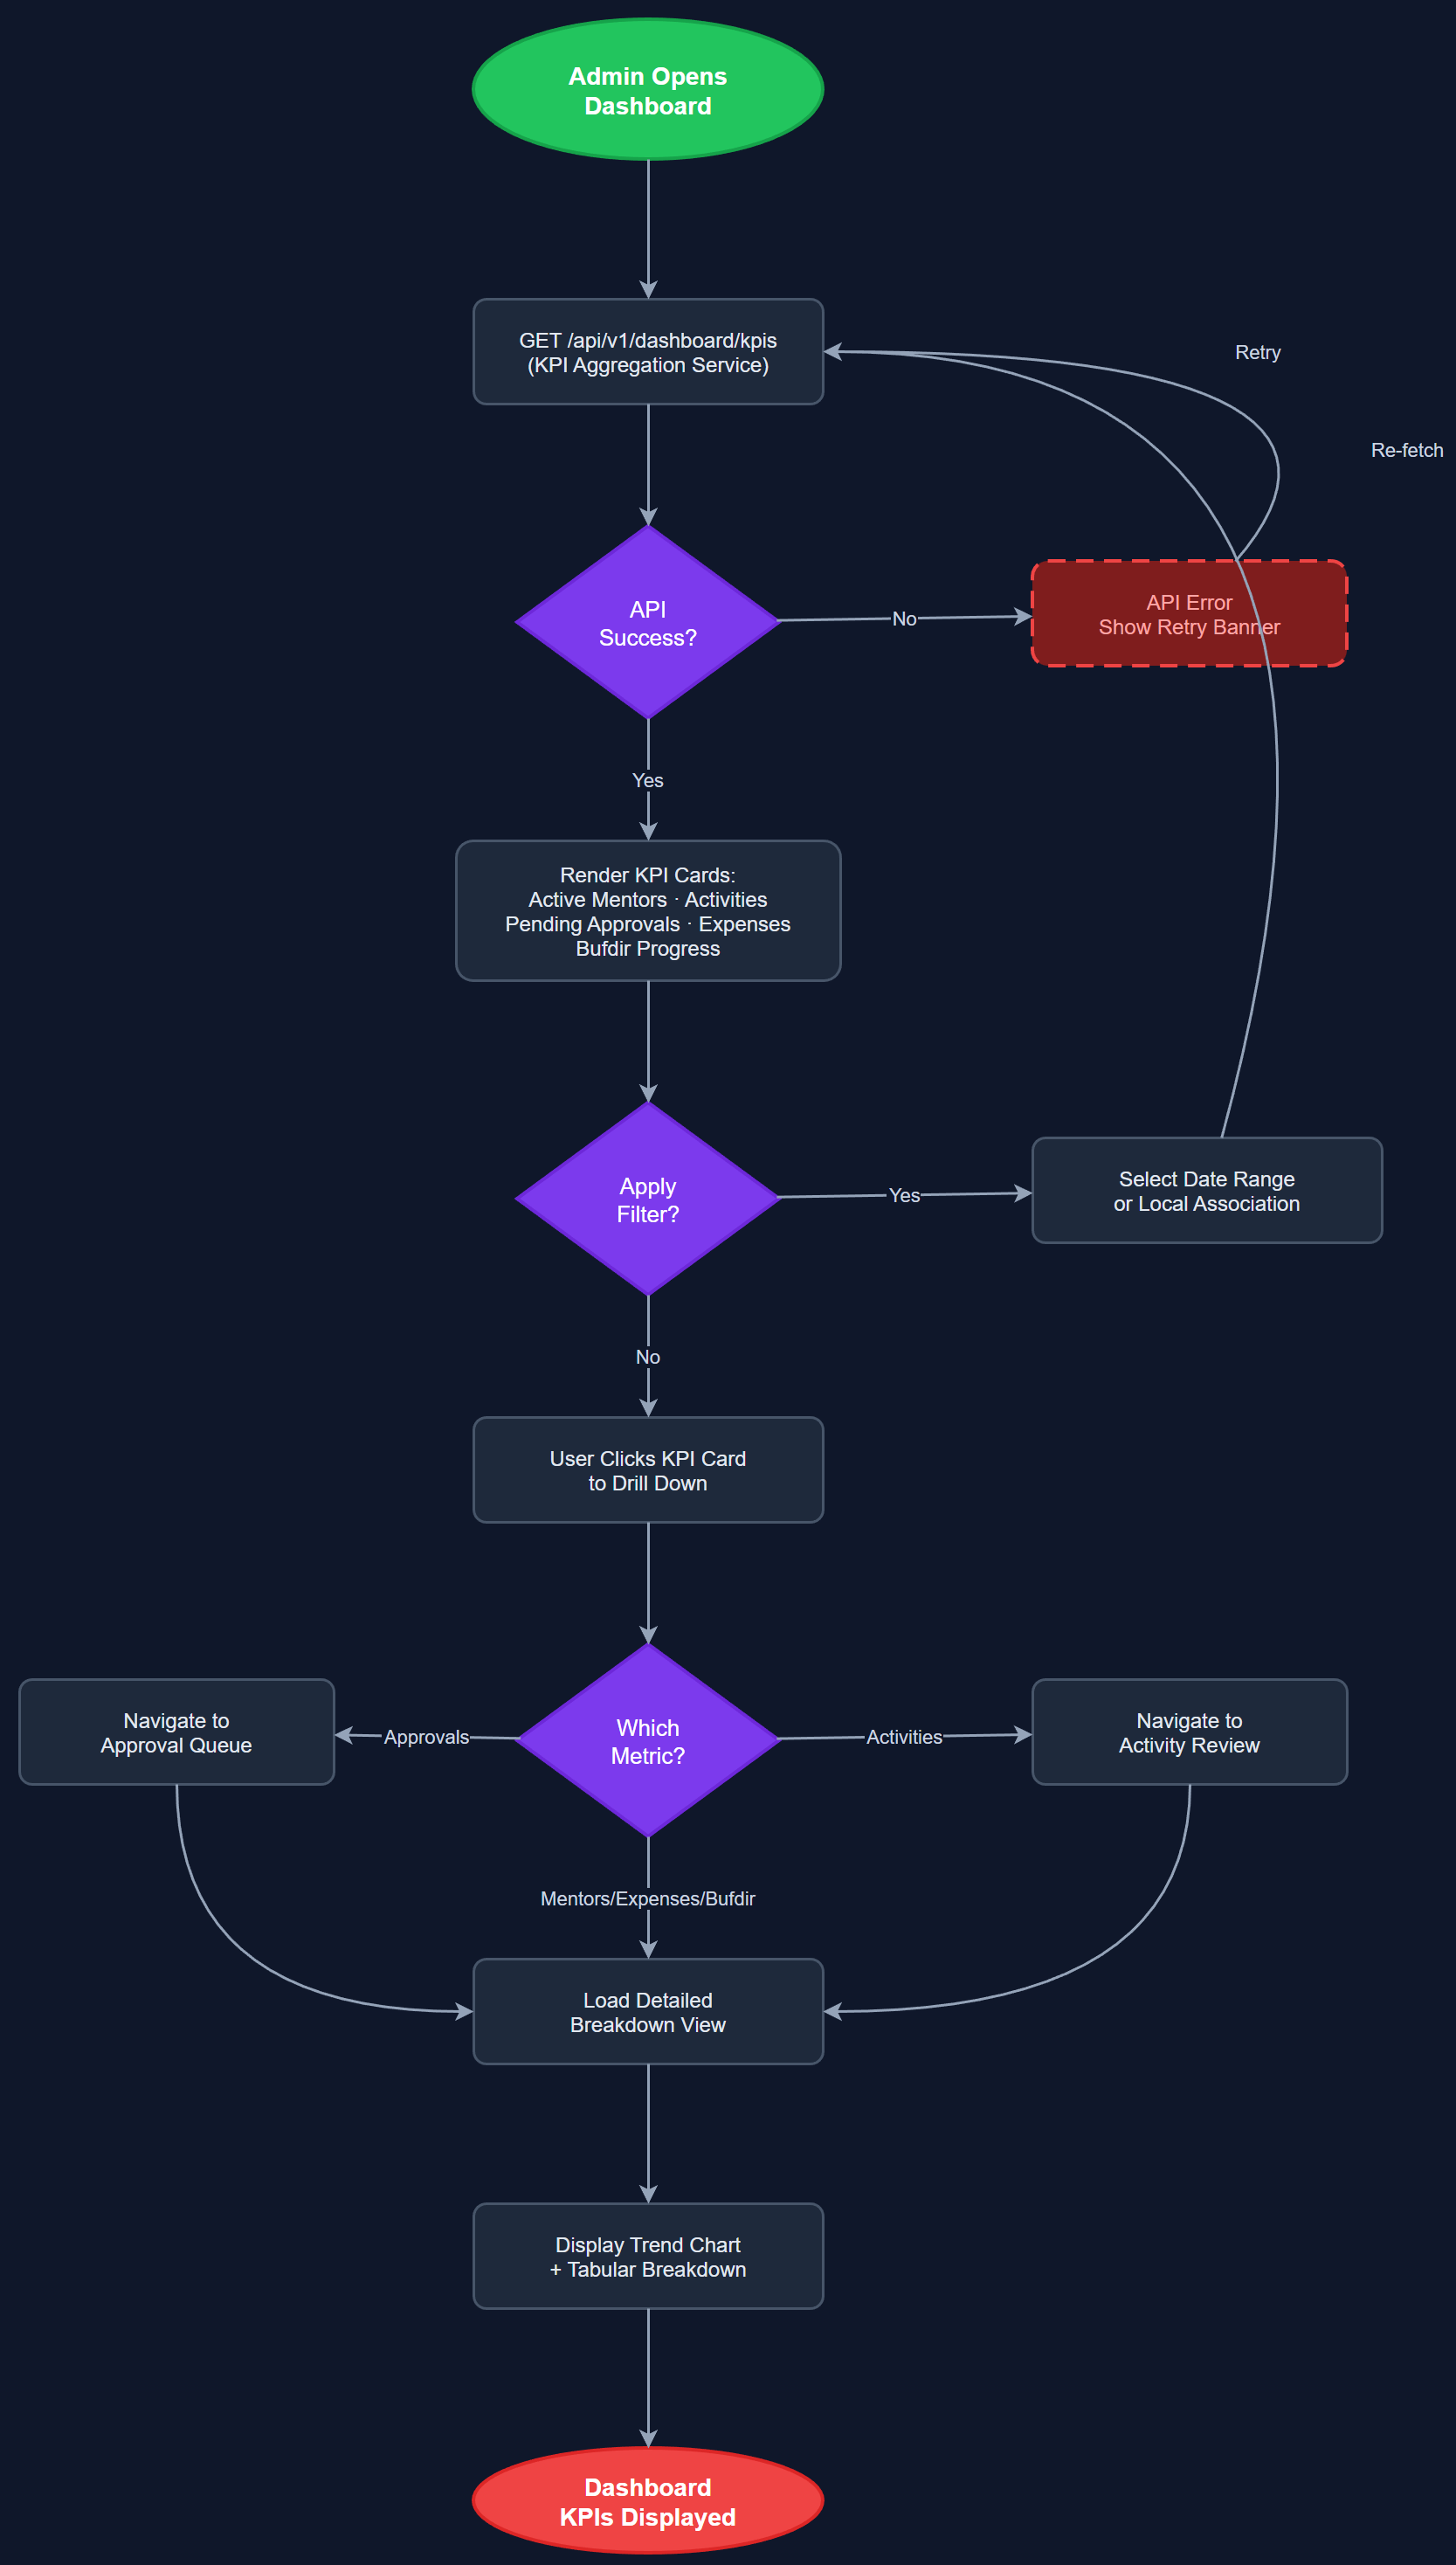
The Dashboard KPIs feature provides organization administrators and coordinators with a real-time overview of key performance indicators for their organization. It aggregates data across activities, peer mentors, contacts, and expenses into a single, actionable dashboard view. Metrics include active peer mentors, total activities logged, pending approvals, reimbursement totals, and Bufdir reporting progress, giving admins an at-a-glance health check of their organization's peer mentor program.
User Flow
Analysis
Organization administrators currently lack a consolidated view of their program's operational health, forcing them to navigate multiple systems and manually aggregate data. This feature eliminates that overhead by surfacing the most critical metrics immediately upon login, enabling faster decision-making and proactive management. For Bufdir compliance, having real-time visibility into reporting progress and activity volumes reduces the risk of missed deadlines and incomplete submissions. From a commercial perspective, a compelling KPI dashboard is a key differentiator that demonstrates the platform's value to prospective organizations during demos and trials, directly supporting sales conversion for the Product Sales Website audience.
The KPI dashboard is implemented as a Next.js server-side rendered page within the admin portal, querying PostgreSQL via the shared REST API (`/api/v1/analytics/kpis`). Aggregation queries are scoped by organization ID for strict multi-tenant isolation. Key metrics are computed using SQL aggregates with appropriate indexes on `activities.created_at`, `activity_approvals.status`, and `expenses.status`. The frontend uses a responsive card grid layout with Tailwind CSS. Data is fetched on each page load via SSR for accuracy; client-side polling can be added in a later iteration. Role-based visibility ensures coordinators see their local association scope while org admins see the full organization.
Components (114)
Shared Components
These components are reused across multiple features
User Interface (12)
Service Layer (34)
Data Layer (22)
Infrastructure (38)
User Stories
No user stories have been generated for this feature yet.